
SAT Percentiles: An Ultimate Guide

After a student takes the SAT examination, he gets an exam report after a few weeks. In this report, the students get SAT scores merged of all subjects, and with this, they get a percentile. This SAT percentile is a decisive factor for college admission.
Further, in this blog, we will understand everything about the SAT percentiles. But before we proceed to the SAT percentiles, let's see what a percentile is in brief.
Many students get confused between percentage and Percentile. But, Both these terms are not synonyms of each other but much different from each other. The percentage is a ratio or number, which represents your score in a fraction of 100. In contrast, the Percentile is a comparison of your score with the score of other students.
For example, if your percentage is 80%, this means your score is 80 by a fraction of a hundred. But if your Percentile is 80, it means your scores are better than 80% of the students who attended the exam. Hence, not to get confused between percentage and Percentile.
What are SAT Percentiles?
When receiving a composite score, you will also receive your SAT percentile, ranging from 1 to 99. The SAT score report provides two percentiles. Percentile of the total score and score for both the sections. These sections are evidence-based reading and writing and math.
SAT percentile depends on where your score is, between the score range. The score ranges from 400 to 1600, 400 is the least, and 1600 is the "perfect score." The higher your score range, the higher your Percentile. this shows the specific percentage of the people you performed better.
There are two types of SAT percentiles:
- National Representative Sample
- SAT User Percentile
A national representative sample is a score derived through research. This research takes place on 11th and 12th-grade students in the USA. It takes place regardless of the students have given the SAT exam or not.
The other type is SAT User, based on the actual scores of students who took the SAT exam. The past three year's SAT exam test-takers score taken into consideration.
What is the SAT Percentile Score Range?
The CollegeBoard publishes score ranges for, who conduct the SAT exams. According to the CollegeBoard, score ranges represent the student's ability better than points.
Percentile scores assigned to the specific range of numbers, where the least is -1, and the most are 99+. -1 shows that less than 1% of students scored below you in the exam. Whereas 99+ shows, the students who scored below you are more than 99% of test-takers.
The following is the table for composite score range with SAT percentile:
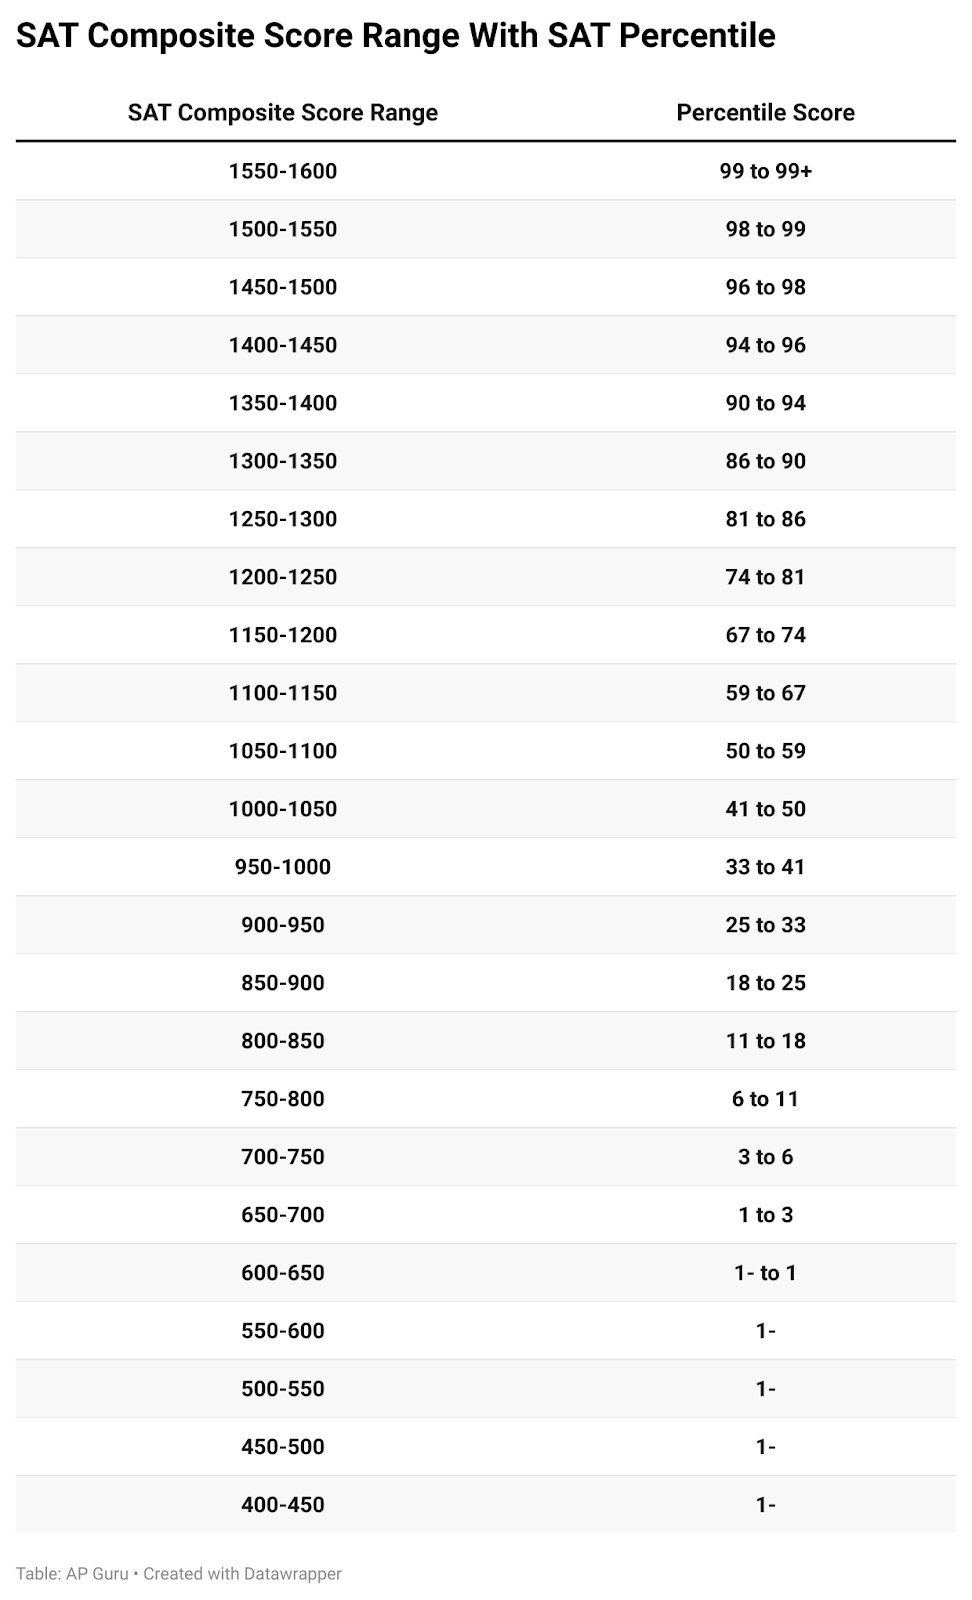
As we can see, For the middle score range, percentile ranks are changing faster. Whereas, if you see above or below score ranges, you will see it doesn't change as quickly as it changes in the middle.
The percentile point gap between 1100 to 1240 is 59 to 81. But, in the score range 1450 - 1600, the difference between the percentile points is 4. , between the score range 450 to 700, the percentile point difference is between -1 to 3 only.
The following is the table for separate score range of EBRW and Math with SAT percentile:
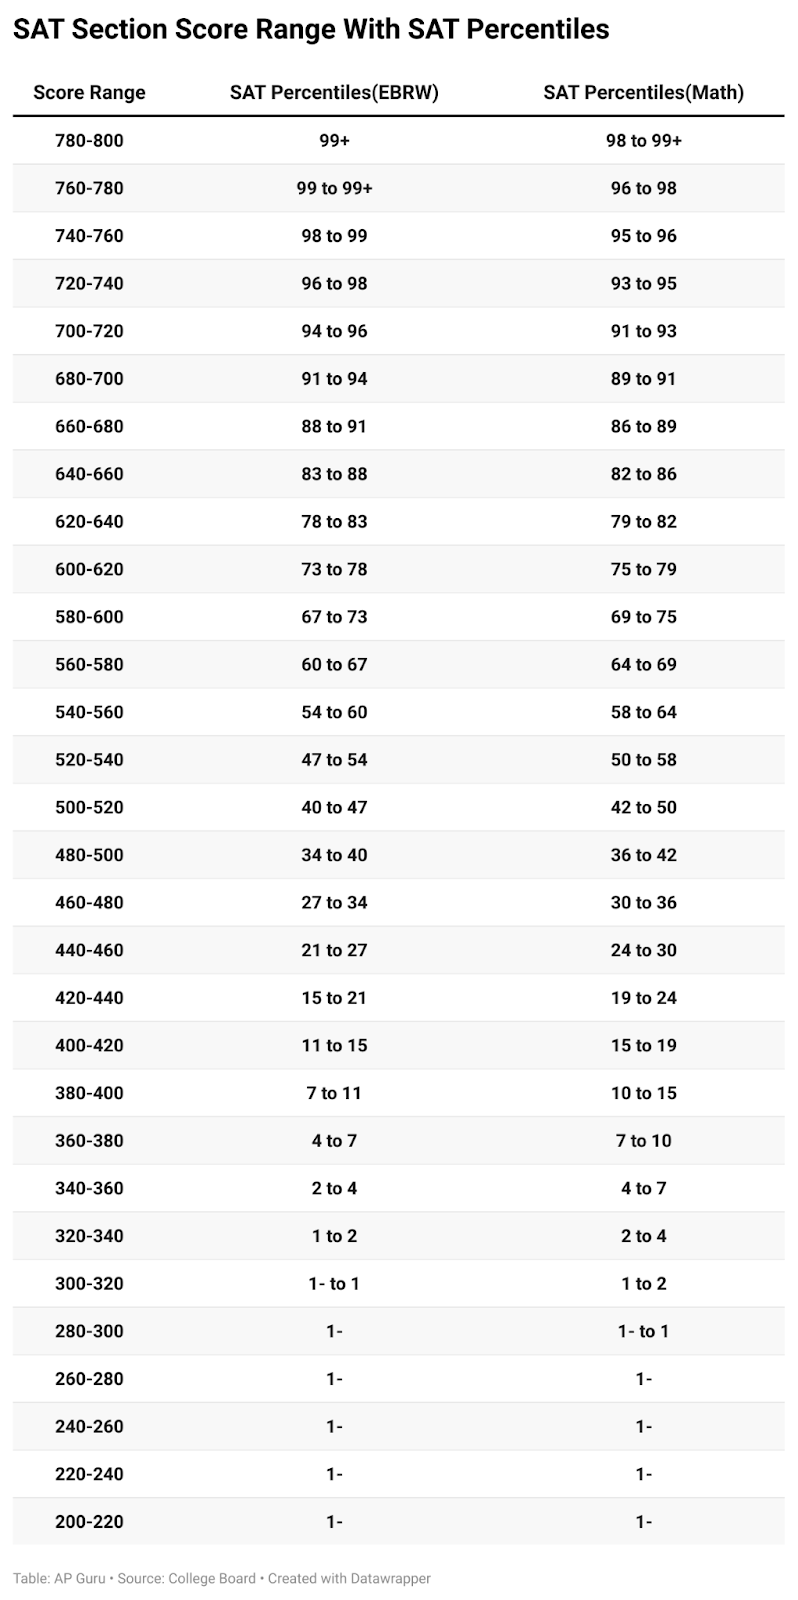
Again, here you will see a dramatic change in middle percentile points. Hence, both tables show a dramatic change in the middle. A 100 to 200 points growth can change your percentile points from bad to good.
But, when comparing percentile points of math with EBRW, the math needs more effort than EBRW. For example, the score range of 760-780 has a 99-99+ percentile score for EBRW but 96-98 for maths.
Thus, if you consider the same percentile points for maths as for EBRW, you need to study harder for math. It's because, to get the same percentile points, you need more SAT scores.
What are SAT Percentile Scores for Schools?
You gave the SAT exam or planned to share it, But your main priority would be getting admission. But a good SAT score for college depends on various factors. The most important of them is the competitiveness and prestige of the college.
Thus, the SAT percentile varies from college to college. It's get decided through the SAT score of college students. For every school, there is an average SAT score, 25th, and 75th SAT Percentile.
- 25th Percentile: Only 25% of incoming students have fewer SAT scores than the given score.
- 75th Percentile: 75% of incoming students have fewer SAT scores than the given score.
- Average Percentile: Average SAT score of students admitted to a particular college.
The following is the SAT score for top universities:

As we can see, there is a difference between every college percentile score. Yet, all colleges have a very high score. The highest average percentile score colleges in the table are MIT and Caltech as 1540. It's an average score of a student admitted here.
The above colleges are the world's most prestigious colleges. Thus, the percentile score is much higher. If you are not trying this college, the other colleges are not as competitive as these are.
How to Find Average SAT Percentile Score for College
The following are the methods:
Browse on the search engine:
The easiest method to find the SAT percentile is to browse on the internet. The query you will use for this is "[school name] percentile." If there is any information google could find, Google will display it on the "featured snippet." If not, then you can click the link in the search results.
Visit the University website:
If you don't find it in a search result, you can visit the university's website. Try searching the bar of the website and type "SAT" or "Percentile" or both. The result will appear on the website. Click the link, which may show the score.
How to aim for percentile score goal
We now know the percentile score evaluated through to the SAT score we gain. Thus to aim for a percentile score, you need to focus on the score range. As we understood, every school has its score range. Hence it is necessary to know the 25th and 75th scores.
You may not wish to apply to only one school. And if I'm correct, you should make a sheet of interested schools. The sheet should mention the 25th and 75th scores of all selected schools. After mentioning all schools and their scores, make the highest score as your goal. The highest would be the highest 75th Percentile in your sheet. Highest score as your aim increases your chance of admission even if you are unable to score the highest. It's because you will still have a chance of getting admitted to other schools.
For example, if your sheet's highest score is 1410 and other scores are 1390, 1380, 1300. Even if you cannot score 1410 or above, you may still have a chance to qualify in other schools. It's possible if you were able to get the SAT score between 1300-1410.
To know what Percentile you need to get, refer to the above table of the composite score range. For the above example of the score range of 1300 to 1410, you should aim to get from 86 to 96 percentile.
It says your score should be at least better than 86% or at most 96% of students appearing for the exam. SAT Percentile shows how competitive the score range is for you.
Do the SAT Percentiles Change?
The short answer is "not much." The SAT percentile score is almost the same every year. Considering the example of the old SAT format, a score of 1880 was stable at the 87th Percentile from 2011 to 2015. The SAT score not changing with the percentile score is the idea of the SAT scoring system. The purpose is to remain almost the same every year. There's no meaning to compare if 1440 was 60th percentile in 2011 and 75th Percentile in 2014.
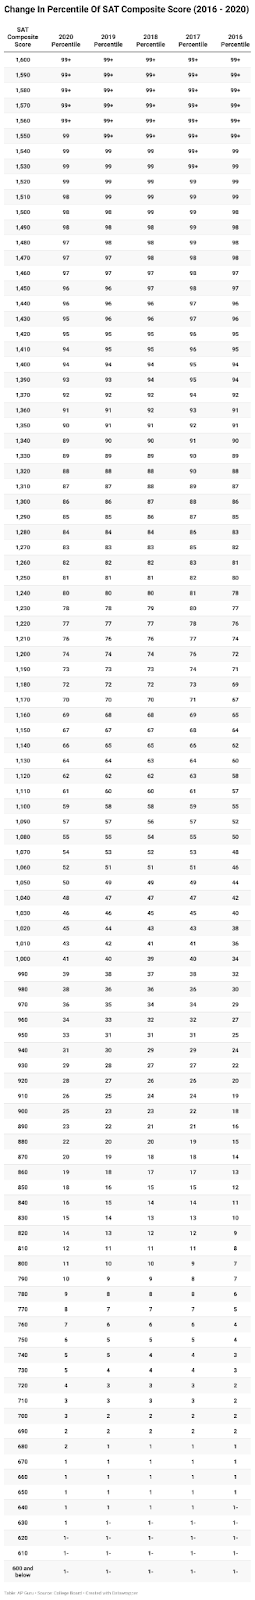
Although every year, there is little change in the new SAT score format. For example, the score 1250 was 80 in 2016, 82 in 2017, and 81 in 2018, 2019, and 2020. The middle range of 800 to 1200 has the highest number of changes. But the top and bottom score ranges don't change much.
If this same format remains in use for more years, changes in the score range will decline. But, for now, you should keep in mind that the score may change, especially in the middle.
The following is the change percentile from 2016 to 2020:
How Does the Percentile Benefit You and the School?
Percentile score will benefit you to know your performance, compared with other students. Because it shows how better you performed than a specific percentage of students.
If your percentile score is above 75, you are above three-quarters of test-takers. And if it is 50, you are an above-average test-scorer. Same like that, it also helps schools decide their 25th and 75th Percentile. They do it with the help of SAT scores of the students admitted to the school. It helps them to decide which new students they should take.
Also, the Percentile helps you to check your section score of EBRW and Math. The same score for math and EBRW doesn't come with the same Percentile. As mentioned above, you need a higher math score for the same Percentile as EBRW. If you ever want to reappear for the exam, the individual scores can help identify where you are lacking.
The Percentile score shows a slight increase or decrease in the composite score. It can have a significant impact on the percentile score. The effect is high if a score is in the middle range, which can be crucial during admission.
How SAT Percentiles Gets Calculated
To find an SAT percentile score, you need to find a z-score. The z-score is a standard deviation for a given value that lies away from the mean.
https://www.youtube.com/watch?v=Llo7BLq9rVk
For example, let's consider a normal distribution: bell shape, unimodal, and symmetric.
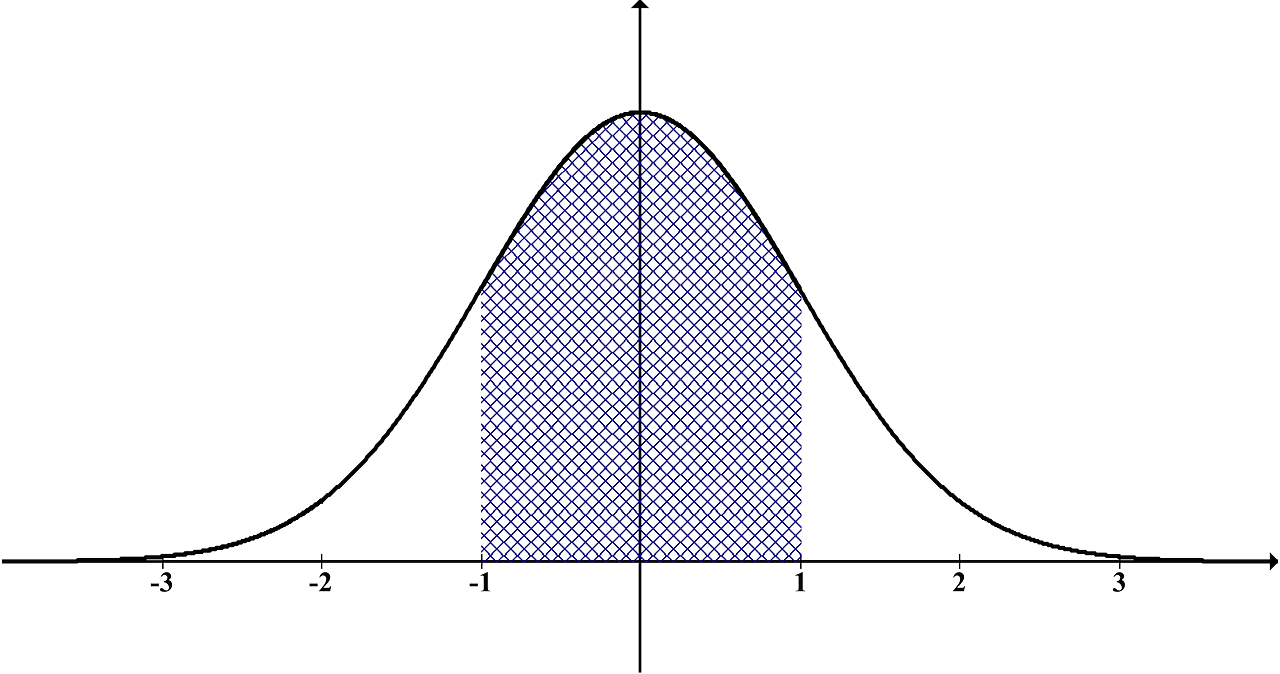
The mean(μ) is present towards the center of the normal distribution. The μ+1σ represents data that lies one standard deviation away from μ. As it is on the right side of μ, its z-score is +1. The μ-1σ represents data that lies one standard away from μ, but on the left side of μ, it's z-score is -1.
z-score can also be represented by formulae z = x-μ/σ. In this case, x = given value, σ = standard deviation, μ = mean.
For example, a student scores 1010; thus, the given value(x) is 1010. we'll take an SAT 2019 exam's mean score, 1059, and the standard deviation of 210.
with this we get,
z= 1010-1059/210, and this gives z= -0.23.
The "normal probability" of the z-score is the value we need, which is 0.409. probability 0.409 means 41% of data lies below the mean score. Thus the percentile score we get is 41.