
SAT Score Percentiles: A Highly Accurate Version

The best way to understand your SAT scores is to know your SAT score percentiles. You can become competent to maximize your study time, get the most significant score gains, and impress your dream school by understanding percentile rankings.
Understand What is Your SAT Score Percentiles?
To understand clearly, look at our comprehensive article on "Guide to SAT Percentile" to maximize your SAT score—and your college admissions chances.
In layman's terms, your SAT percentile ranking tells you how you performed in comparison with everyone else. So if you got an 80th percentile score, you scored better than 80% of all other test takers.
Remember that your percentile is different from a test score out of 100. A test score represents the number of questions you got right, and a percentile refers to the number of test-takers you performed better than.
What Are the Exact Percentile Ranges for the SAT?
Generally, most of the charts, including one from the College Board, only give SAT percentiles to two accuracy digits. It results in a lot of silly tables.
For example, on the official percentiles table of the SAT, many SAT scores map to the 99th percentile. Remember, on the composite scores chart, 10 scores (from 1510 to 1600) correspond to the 99th percentile.
On any day, I wouldn't call it precision for many reasons. For example, although a score of 1510 is in the same percentile as a perfect 1600 is, you can presuppose that very few far test-takers get a full 1600 than they do 1510. If you are getting near the top of the score range, knowing high-precision SAT percentiles can be very significant.
Also, the student who scores less than near-perfect SAT scores, high-precision percentiles can be beneficial. Remember this, and you have to understand that every percent matters to get into a great college. (just like in your life, every small step counts).
Let's say you find out that you improve from the 50th to the 51st percentile. Here, it could be either of two things, i.e., only a tiny jump from 50.4 to 50.5, or it could be a massive leap from 49.5 to 51.4. Please realize that one is 19 times larger than the other! High-precision SAT percentiles assist you in understanding more about your own SAT scoring abilities and development.
A highly accurate, 6-Digit SAT Percentiles Chart
To create this table, we used official SAT score data from 2015. Yes, I know you have a question, why use old score data of 2015, not of 2021, because 2015 was the last time the College Board published charts showing the exact number of test-takers that got every possible score on an SAT.
Presently, they only release ranges. However, because percentiles do not change much from year to year, these highly accurate percentiles should still hold today.


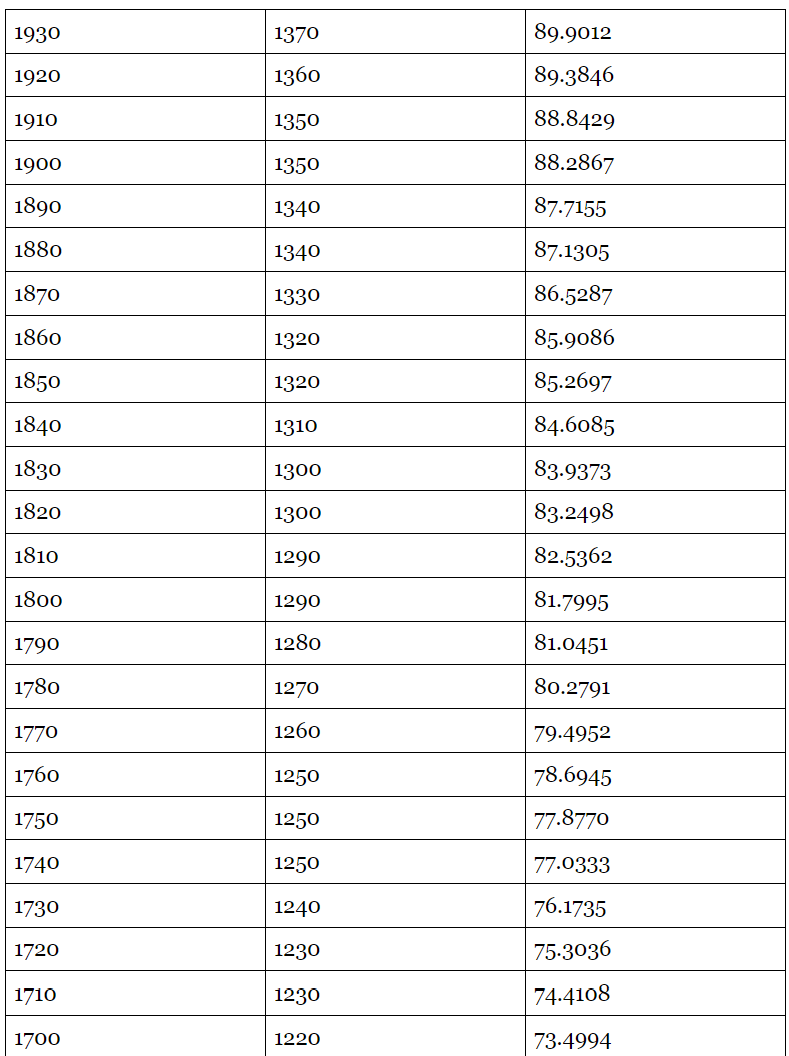

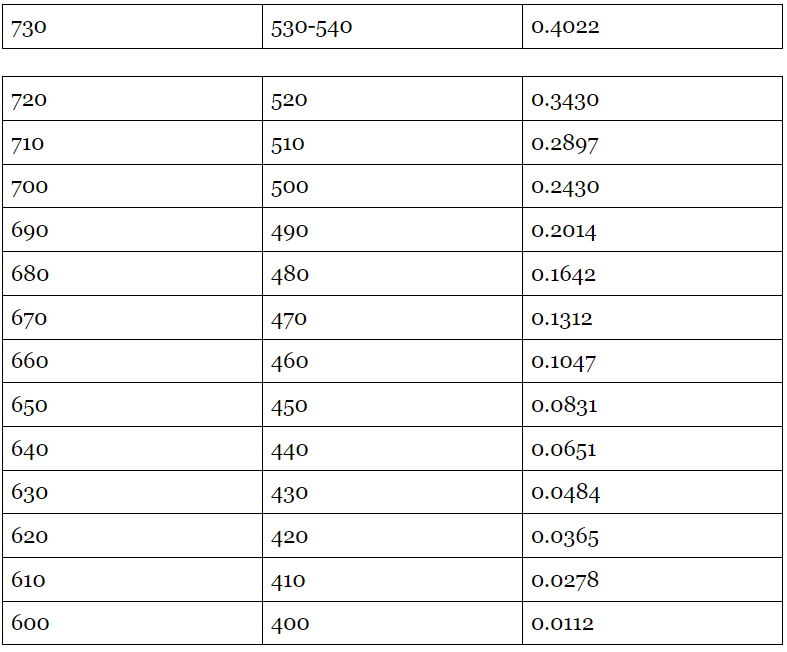
In the chart above, we calculated the SAT score percentiles by using real data declared by the College Board on the exact number of students who earned a specific score. After that, we added the exact number of students to the single individual) to get the percentile. Remember, this is not an estimate.
If you look into a score group(e.g., those scoring exactly 2110), we speculate exactly half are above, and half are below so that 600 does not correspond to 0.0000 percentile, nor does a perfect 2400 correspond to 100.0000 percentile exactly.
An important note about the current SAT vs. the old SAT: The table above is from the old SAT, with assigned new SAT scores. It signifies that recent SAT scores are not directly from the current SAT; they get calculated from how old SAT scores convert to new SAT scores.
It is acceptable if you want a rough mapping between the two. Sadly, the College Board, like earlier, doesn't release the exact numbers of test takers for each score, so we can't update this table for 2021; anyway, the percentiles shouldn't have changed much.
Register now for Our Flagship SAT Prep Program to get a Perfect Score.
Conclusion
To summarize, SAT score percentiles do not change much every year, so that you can use any of the 2013, 2014, 2015 scores for each other. But make sure not to use very early years (e.g., 2003) because the test does suffer from some long-term drift.
Remember that the SAT underwent a massive redesign in March 2016, moving from a 2400-point scale to a 1600-point scale. Besides this change, SAT percentiles—even those based on the old SAT (e.g., 2015 and 2016)—haven't changed much.
You can always refer to the table above to estimate high-precision percentiles for the current SAT.